MotoFlow 3.0: Stats Dashboard, Heatmaps & Shareable Cards
 MotoFlow 3.0 with speed charts, heatmaps, and shareable stats
MotoFlow 3.0 is here - the biggest update since launch. This release adds features I’ve wanted to build since day one: a comprehensive stats dashboard, speed charts that work for every ride (even imports), heatmaps showing where you ride most, and beautiful stats cards to share with friends and fellow riders.
Here’s what’s new.
Comprehensive Stats Dashboard
All your ride data, organized in one place.
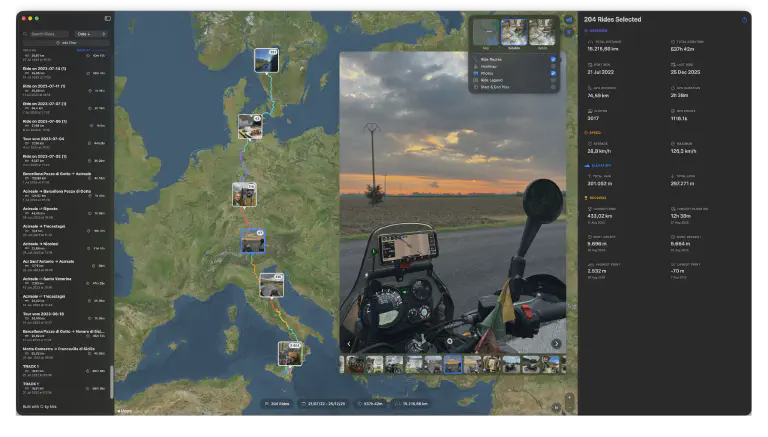
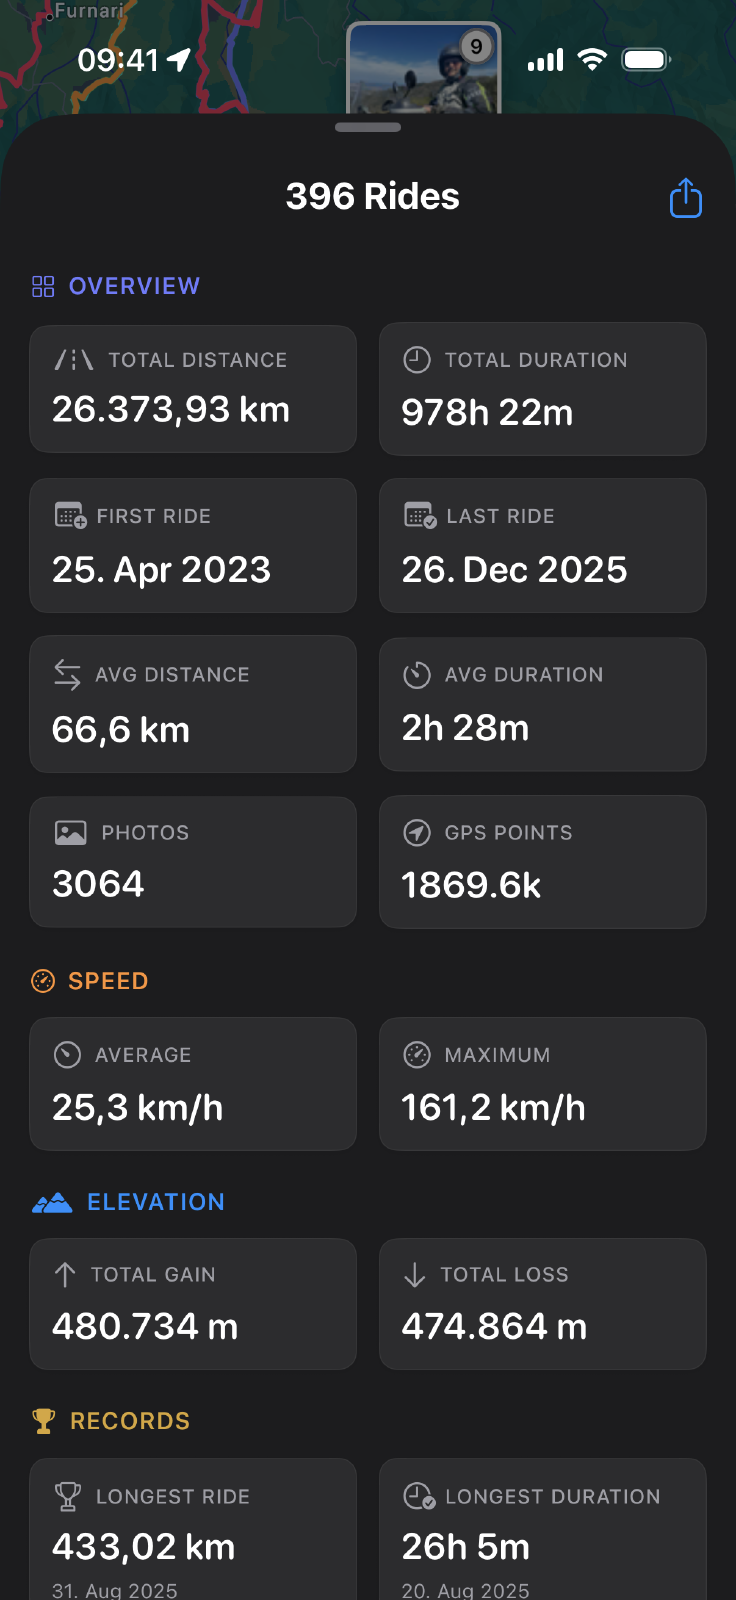
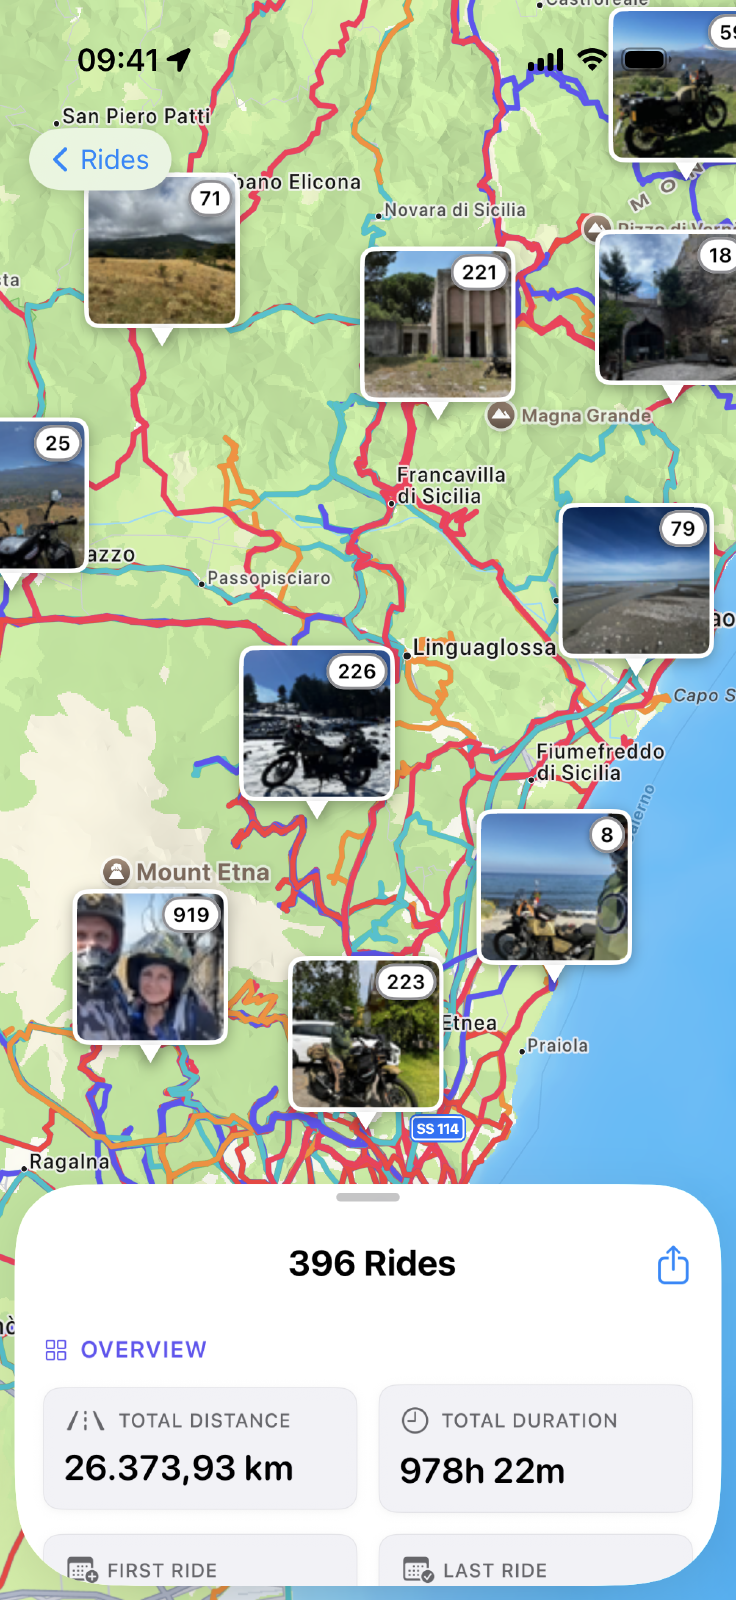
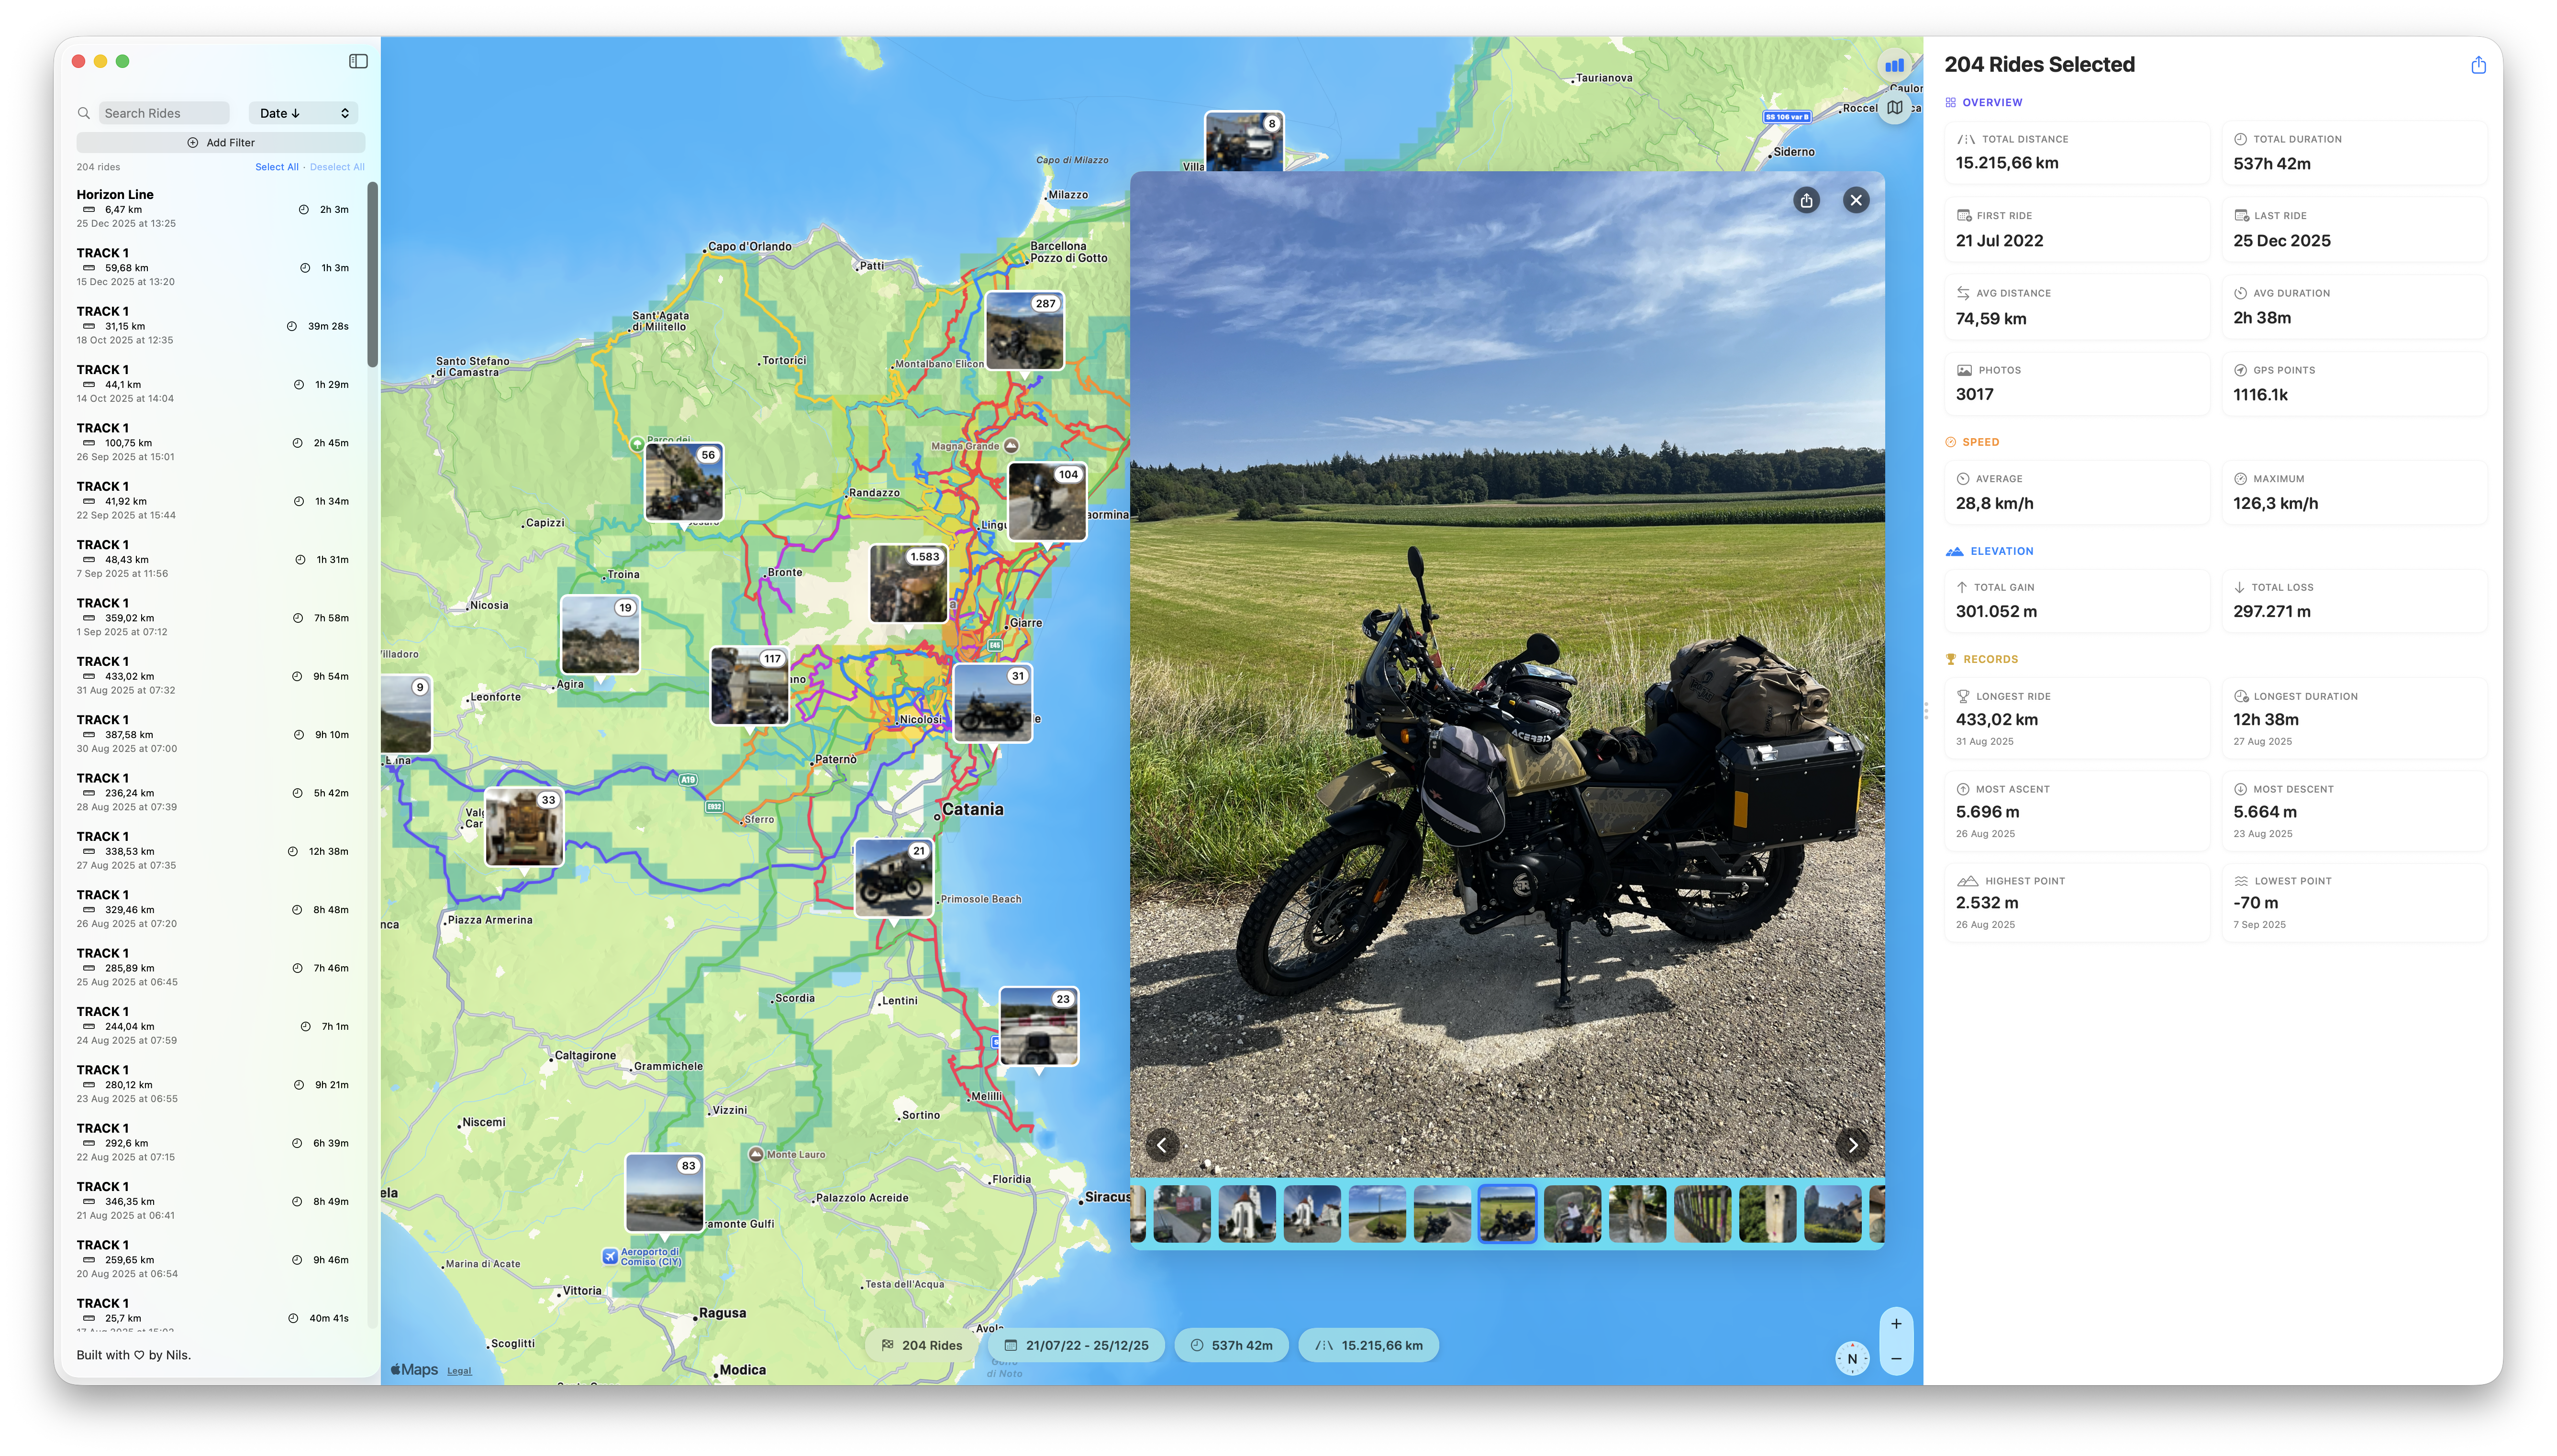
The new stats dashboard brings together everything about a ride: distance, duration, average and top speed, elevation gain and loss. On iOS, it lives in a resizable pull-up sheet - expand it for details, collapse it to focus on the map. On Mac, the sidebar gives you the full picture at a glance.
Speed and elevation profile charts sit right in the dashboard. See how your pace changed throughout the ride. Spot the climbs that slowed you down. Understand the terrain you covered.
The dashboard also handles multiple rides. Select a date range or pick specific rides, and see aggregate stats: total distance, longest single ride, top speed across all selections. Useful for reviewing a season or summarizing a trip.
Speed Charts for Every Ride
Speed profiles existed before, but only for rides recorded with MotoFlow. Now they work for imports too.
Many apps - Calimoto, Scenic, and others - export GPX files without speed data. MotoFlow 3.0 derives speed from GPS positions using a physics-based algorithm that filters out glitches. Your existing imports get speed charts automatically. No re-importing needed.
The speed chart shows:
- Speed over time for the entire ride
- Peak speed and average speed stats
- Clear visual of fast vs slow sections
- Units that match your locale (mph or km/h, feet or meters)
Combined with the elevation profile, you can see how terrain affected your pace. That section where you slowed down? The chart shows the climb that explains it.
Ride Heatmaps
Your most-ridden roads light up - see your riding patterns at a glance
Where do you actually ride?
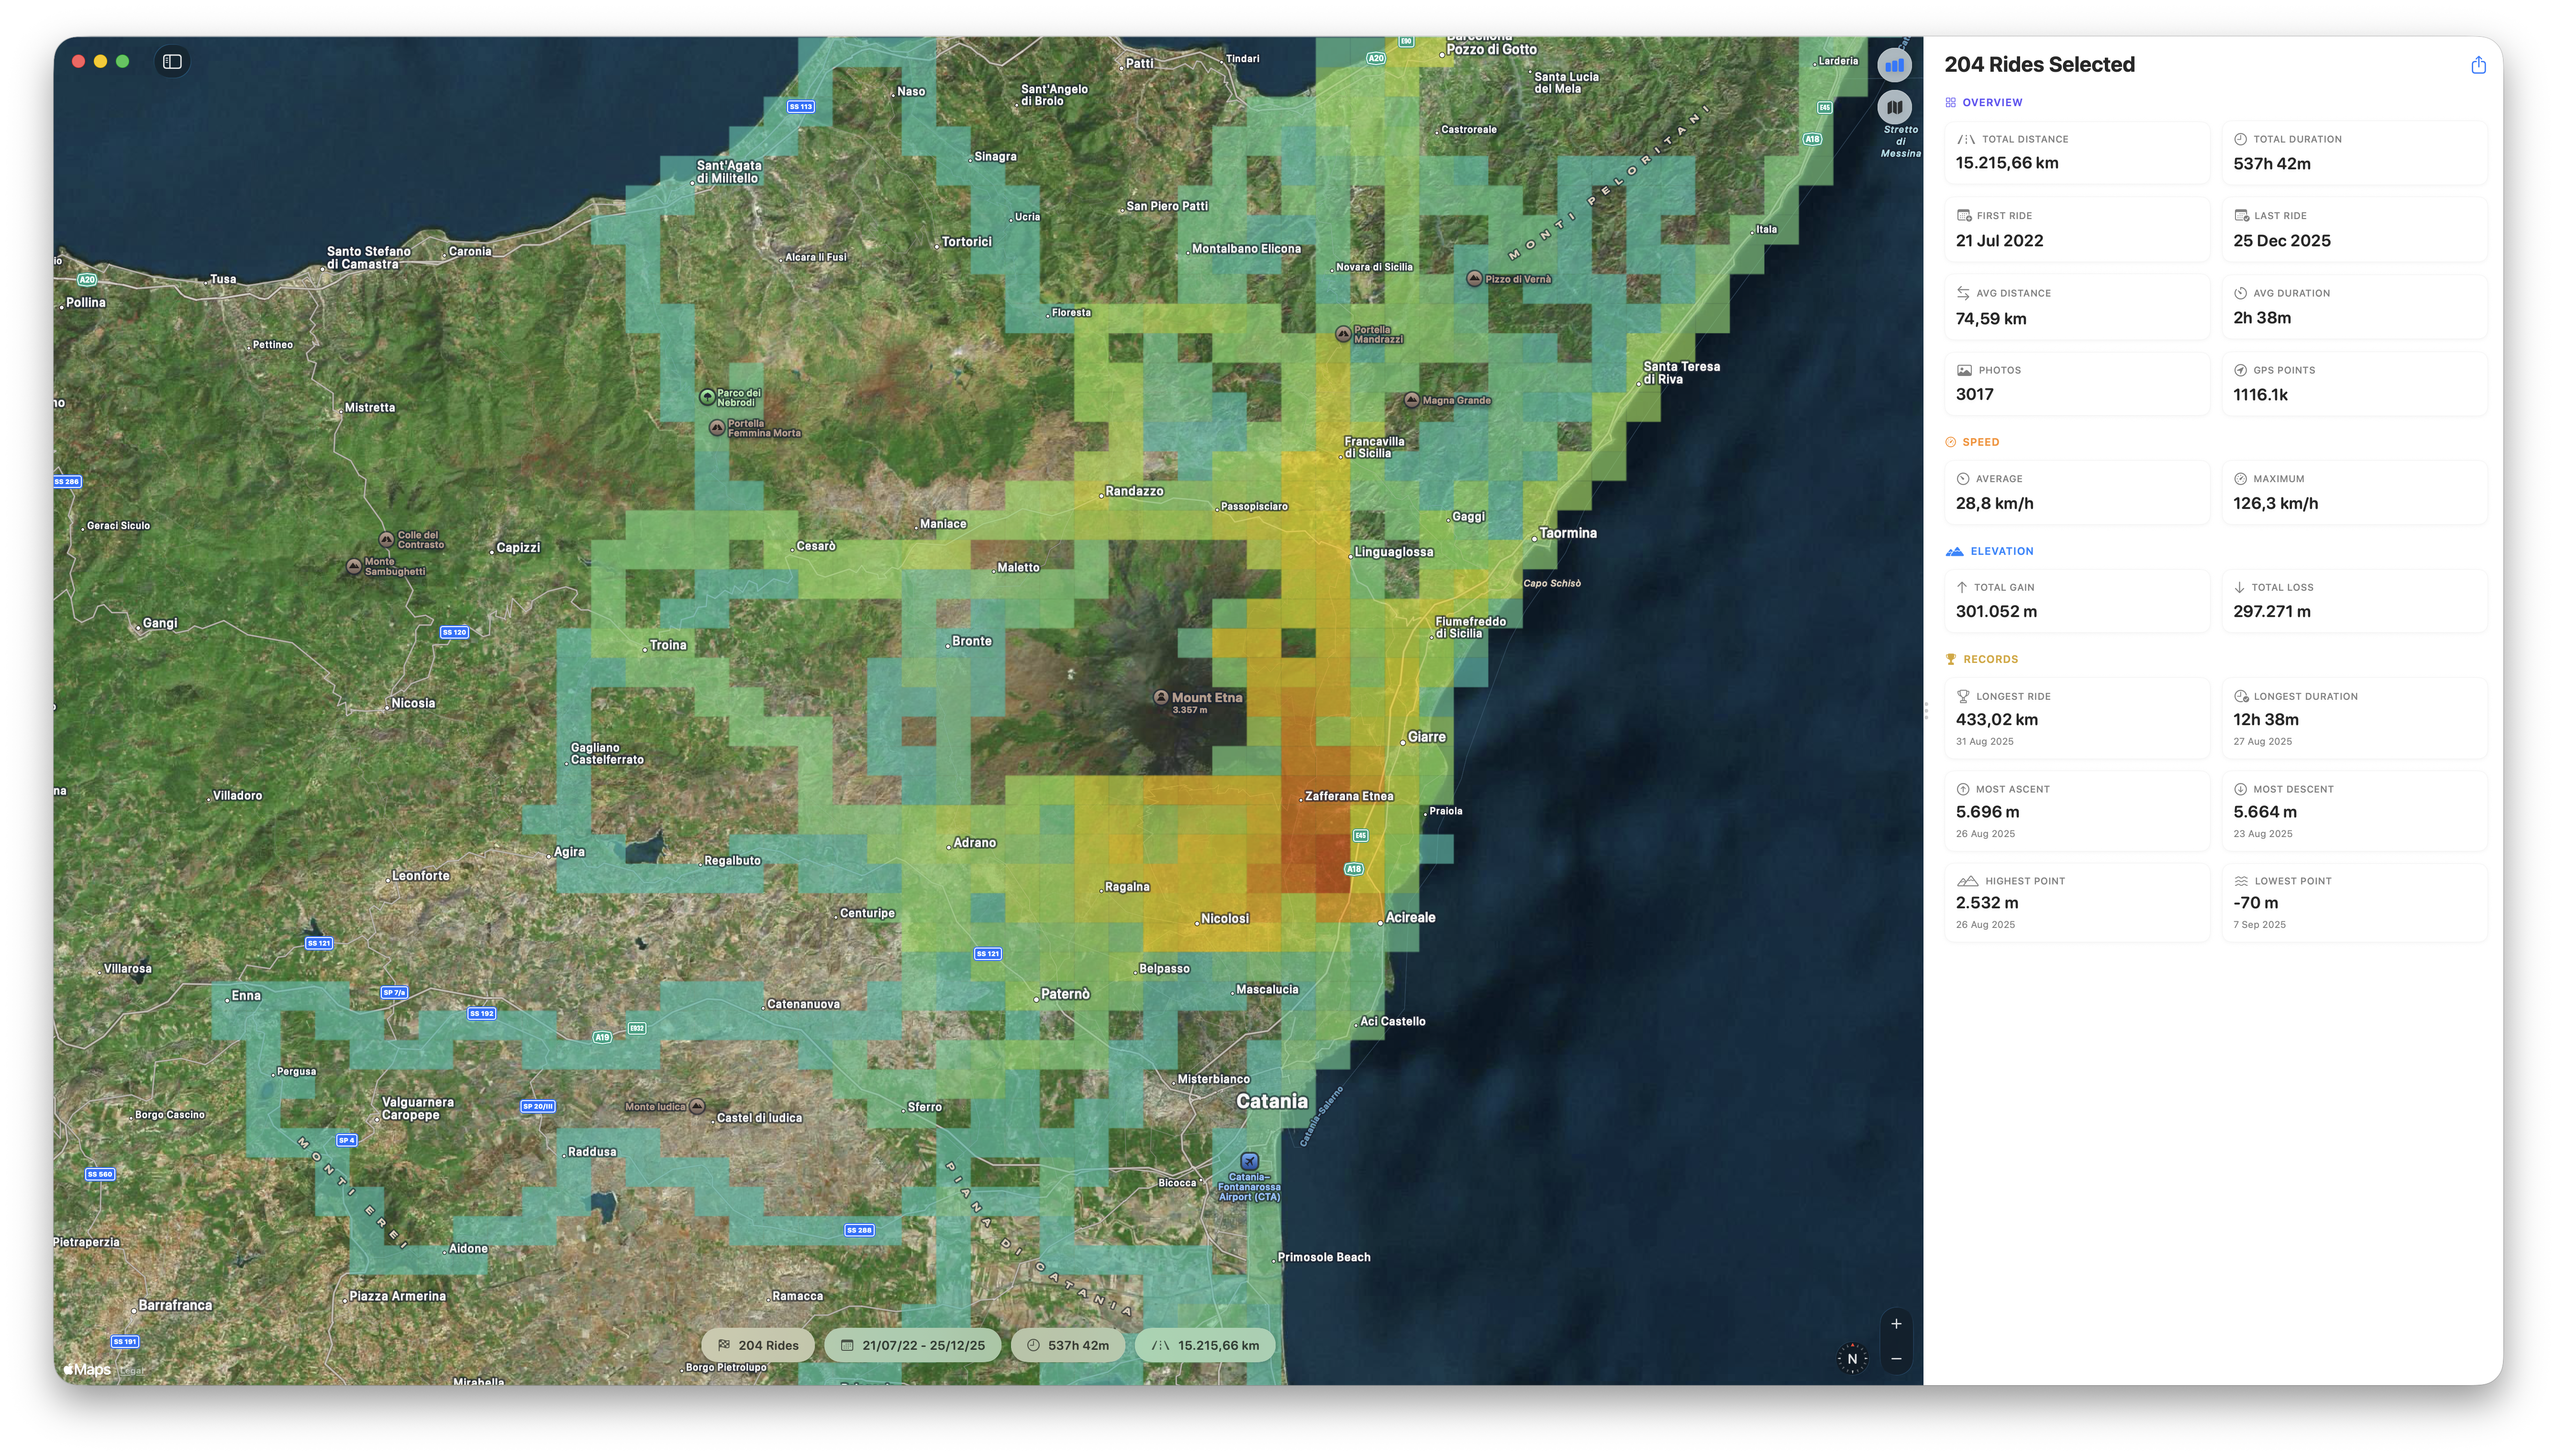
The new heatmap layer answers that question visually. Roads you’ve ridden once appear faint. Regular routes glow bright. Your riding patterns emerge on the map.
Open the multi-ride view, toggle the heatmap, and see your riding territory. The roads from home to your favorite loops. The passes you’ve crossed multiple times. The exploration routes you took once and forgot about.
The heatmap works with any selection - all rides, a specific season, or a custom date range. Filter to last summer and see where that season took you.
Detail adjusts automatically as you zoom, or dial it in manually with the detail slider. Zoom out for broad patterns, zoom in for street-level detail.
Shareable Stats Cards
Create beautiful stats cards in Dark, Light, or Gradient styles
You finished a great ride. Now you can share it properly.
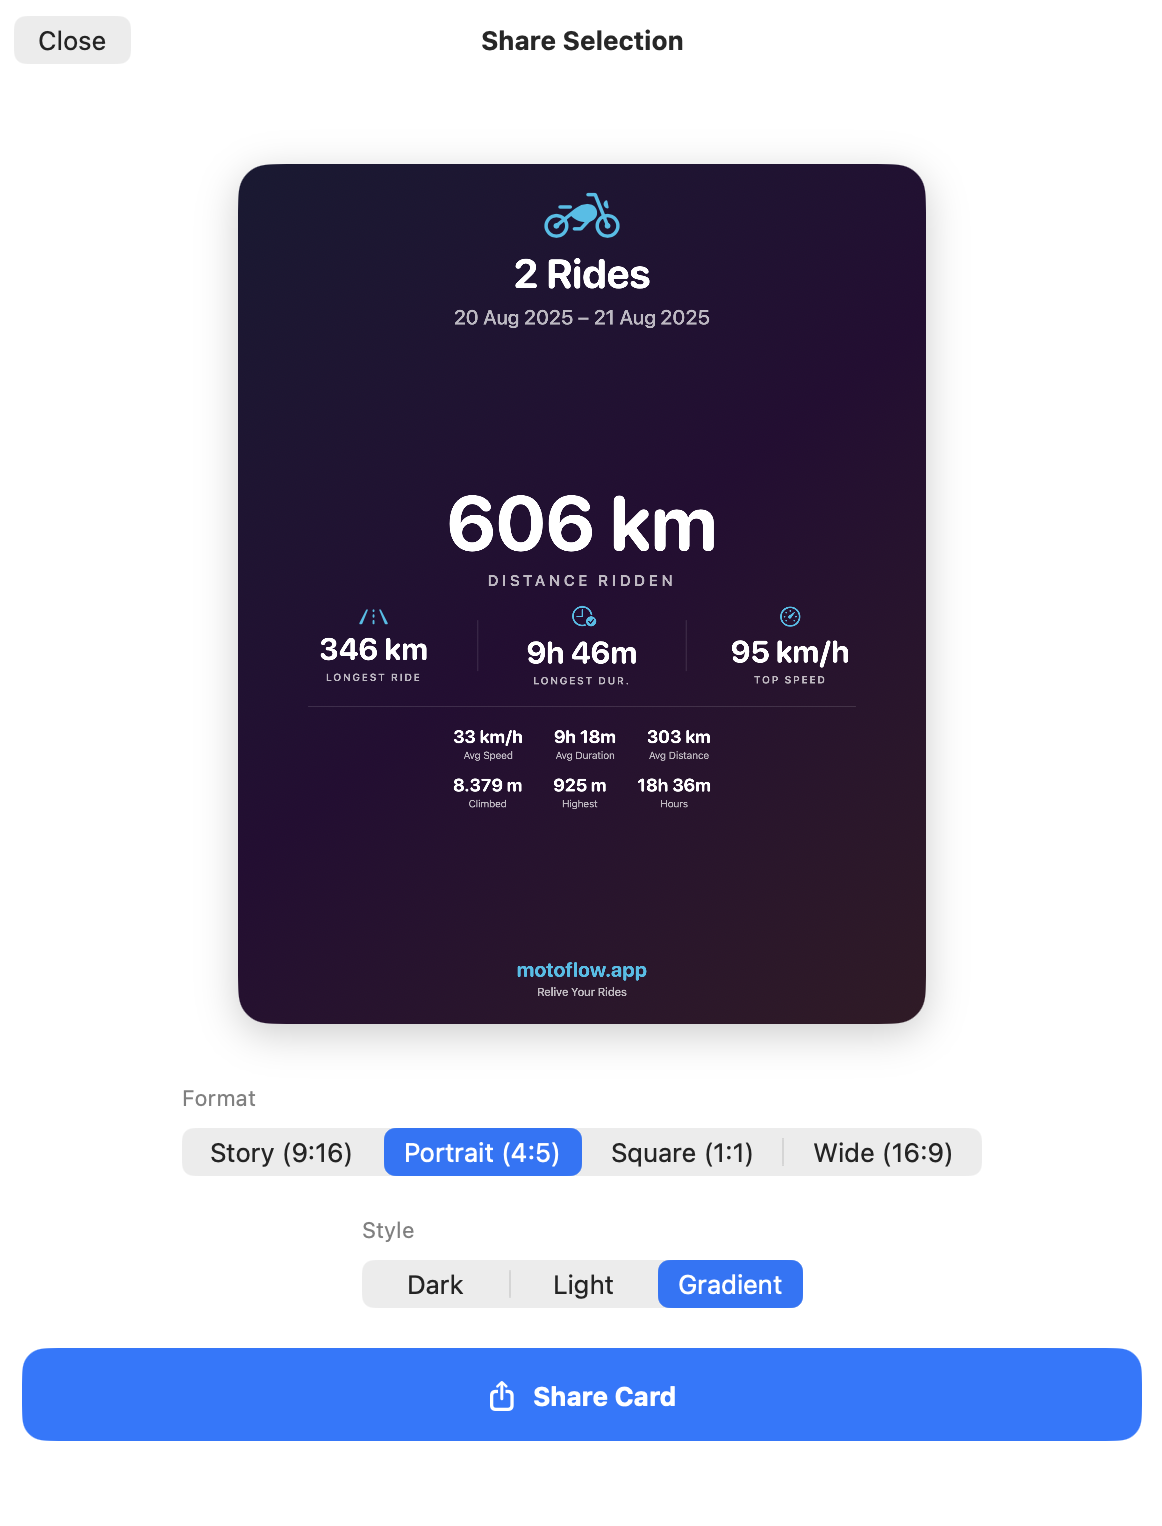
The new stats card feature creates beautiful graphics with your ride data - distance, duration, elevation, speed. Send them to friends via iMessage or WhatsApp, post to Instagram or Strava, or save them to your photo library.
Choose from three visual styles - Dark, Light, or Gradient - and four aspect ratios:
- Story (9:16) for Instagram/Facebook Stories
- Portrait (4:5) for Instagram feed
- Square (1:1) for universal use
- Wide (16:9) for Twitter/X and YouTube
Multi-ride selections create aggregate cards: total distance, longest single ride, top speed across all rides. Share your season stats or a weekend trip summary with a single tap.
Redesigned iOS Experience
The iOS app got a complete visual refresh focused on what matters: the map.
The new ride detail view puts your route front and center. Stats live in a pull-up sheet you can resize however you like. Photos appear in a scrollable strip. The ride is the hero, not chrome and buttons.
Photo viewing now happens within the stats sheet - swipe through photos while seeing exactly where each was taken on the route above. Tap a photo annotation on the map and the strip scrolls to match.
The multi-ride view gets the same treatment. Select multiple rides and see them layered on a single map with clustered photo annotations. Useful for planning (where have I been?) and remembering (what did last month look like?).
Reliable background recording. GPS tracking now continues reliably when your screen is locked or the app is in background. The blue location indicator appears in your status bar so you know recording is active.
macOS Power Features
Browse your ride library with keyboard navigation and click-to-edit
The Mac app gains serious power-user capabilities.
Speed for imported rides. Import GPX files from Calimoto, Scenic, or any other app, and MotoFlow calculates speed data automatically. Existing imports in your library get backfilled too - no re-importing needed.
Keyboard navigation for browsing your library. Arrow keys move through rides and photos. Escape closes viewers. Browse your entire archive without reaching for the mouse.
Click-to-edit names and notes. Click any ride’s title, type, done. Changes save automatically when you click away.
Duplicate detection during import. Importing GPX files from mixed sources? MotoFlow identifies duplicates and lets you skip, import anyway, or review each.
Share button in the photo viewer. Save or share any photo directly without leaving the app.
Performance
The numbers matter:
- 70x faster photo discovery on multi-ride views
- Instant heatmap panning and zooming (pre-computed zoom levels)
- Photo thumbnails that load reliably with large libraries (3000+ photos tested)
- Faster imports with optimized GPX processing
You shouldn’t wait for your own data. Now you don’t.
Get MotoFlow 3.0
Free update for existing users. New users can try the free tier.
What’s Next
This release focused on visualization and sharing - seeing your rides in new ways and sharing them with friends and fellow riders.
Development continues. If you have ideas for what MotoFlow should do next, reach out. This app exists because riders wanted a better way to organize their ride memories. That hasn’t changed.
Common Questions
Is MotoFlow 3.0 a free update?
Yes. If you already own MotoFlow or Open Road Edition, version 3.0 is a free update. All new features are included.
Do I need to re-import my rides for the new features?
No. Your existing rides automatically get speed charts and work with heatmaps. Speed data is derived from GPS positions for imported rides that didn't include it.
Can I share stats cards via iMessage or WhatsApp?
Yes. Stats cards can be shared anywhere - iMessage, WhatsApp, Instagram, or any other app. You can also save them as images to your photo library.
Does the heatmap show all my rides or just selected ones?
The heatmap shows whichever rides you have selected. View your complete riding history or filter to specific date ranges - the heatmap updates accordingly.
Will speed charts work for my Calimoto imports?
Yes. MotoFlow derives speed from GPS positions for imported rides that don't include speed data. Apps like Calimoto, Scenic, and many others export GPX without speed - MotoFlow calculates it automatically.
Get the Update
MotoFlow 3.0 is available now on the Mac App Store and iOS App Store. Free update for existing users.
New to MotoFlow? The free tier lets you try everything. Open Road Edition unlocks your full archive for a one-time purchase.
Your rides. Your photos. Your data. Now with more ways to see and share them.
Get MotoFlow Today!
Track the ride. Relive the journey.